See Dojix in action
Every screen built for one purpose: helping you find and repeat your edge.
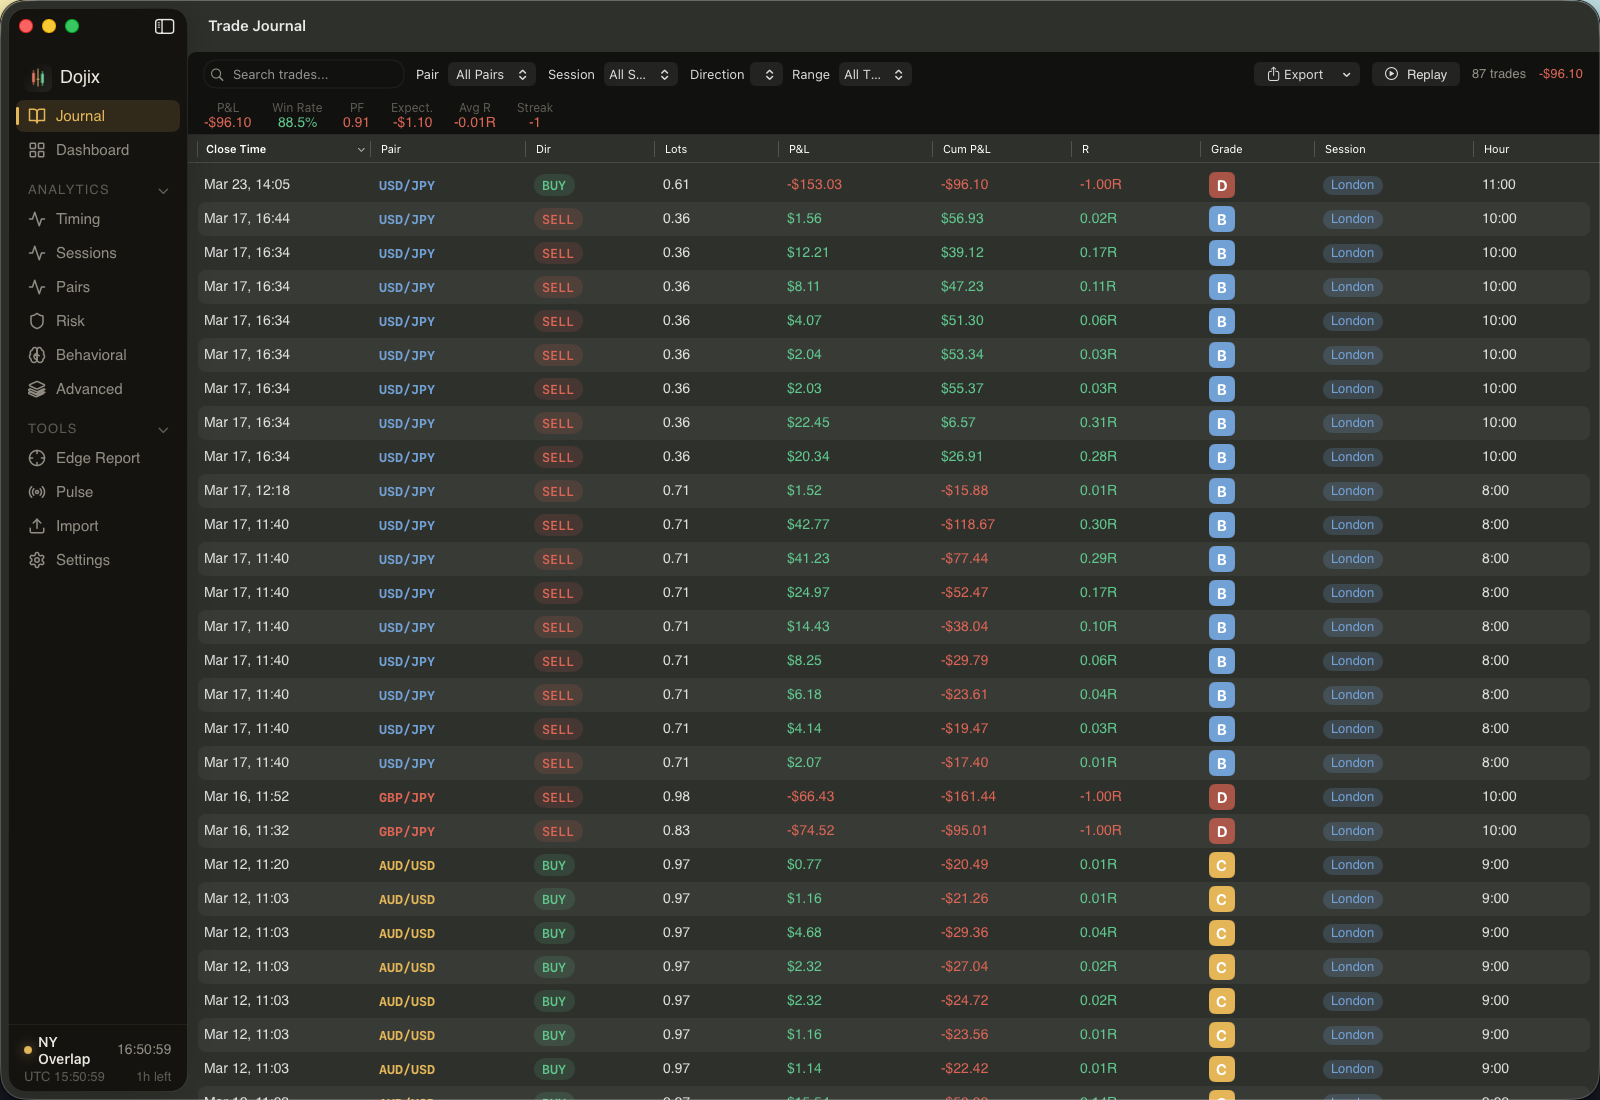
Trade Journal
Every trade logged with P&L, R-multiple, session, hour, grade, and running cumulative equity. Add notes, tags, screenshots, emotional state, and commission costs per trade.
- Auto-graded A-F on 4 dimensions
- Filter by pair, session, direction, date range
- Cumulative P&L column shows your equity curve inline
- Trade replay with play/pause and running stats
- Export to PDF or CSV
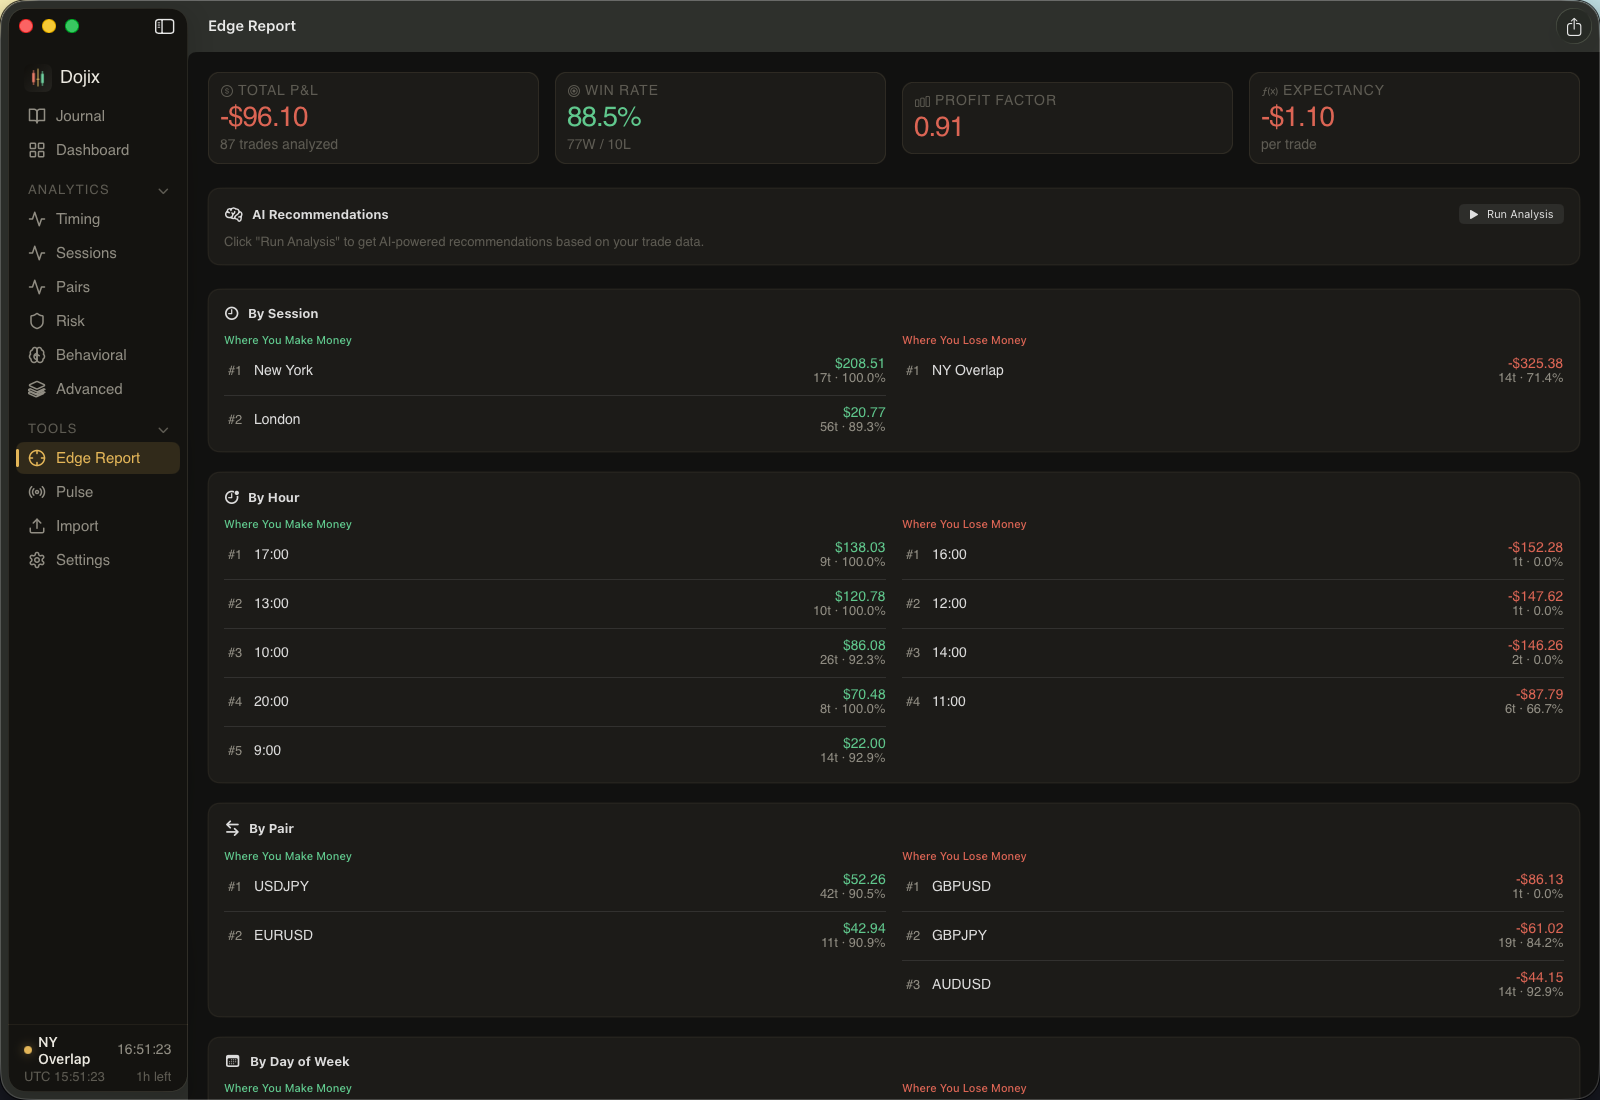
Edge Report
Ranks your top 5 money-makers and money-losers by session, hour, day, and pair. Dollar amounts on everything. No guessing where your edge actually is.
- AI analysis: 3-5 ranked recommendations with dollar impact
- Bias alignment and volatility regime breakdown
- Tag analytics for custom setup tracking
- Post-close continuation analysis
- What to Cut Advisor: what's costing you, with numbers
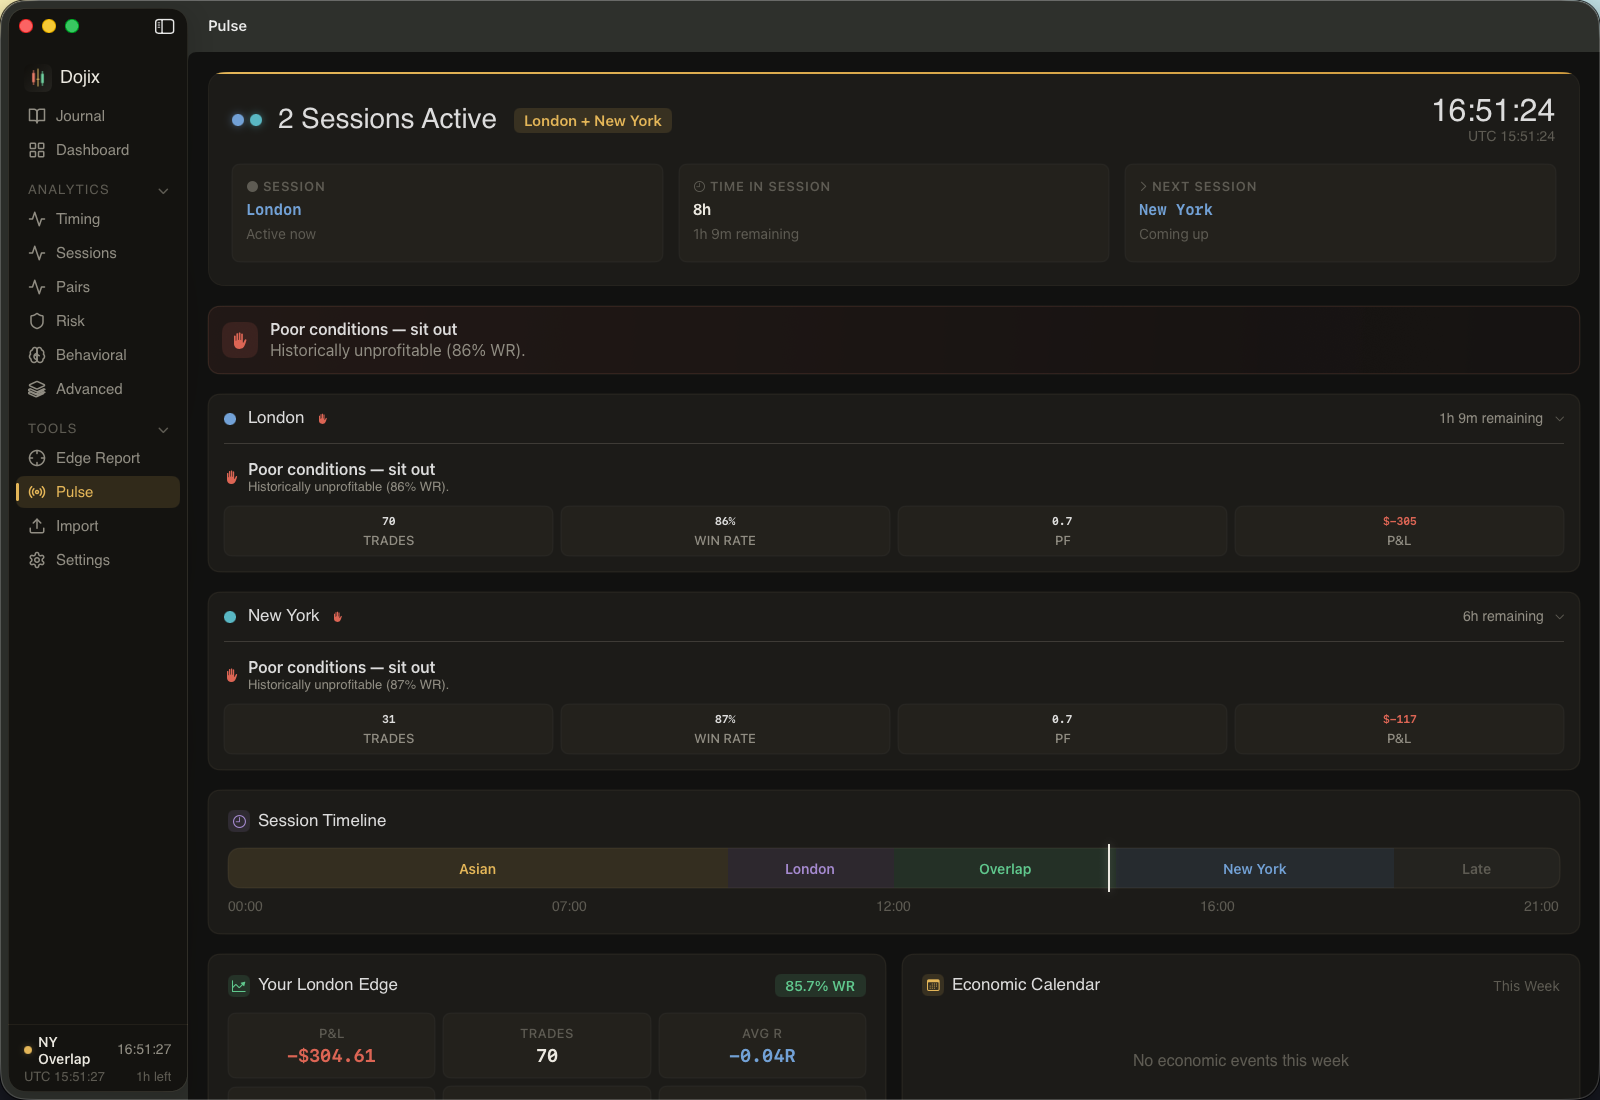
Pulse — Live Session Intelligence
Real-time session clock with time remaining, economic calendar with high-impact event alerts, and a personalized edge signal that tells you whether current conditions match your best setups.
- Live forex quotes from 5 data sources (incl. MT5 direct)
- Danger zone alerts before high-impact news
- Currency strength bars
- Session intelligence: FOCUS / OK / REDUCE / AVOID
- Full-week economic calendar with historical performance
Monte Carlo & Risk of Ruin
Run 1,000 randomized simulations of your trade history. Know your probability of hitting targets and your mathematical risk of blowing the account.
- 1,000 equity curve simulations with confidence bands
- Probability of profit, target hit, and max drawdown
- Risk of Ruin: Kelly criterion with probability gauge
- Exit efficiency: how much money you leave on the table
- Commission & swap cost tracking by symbol
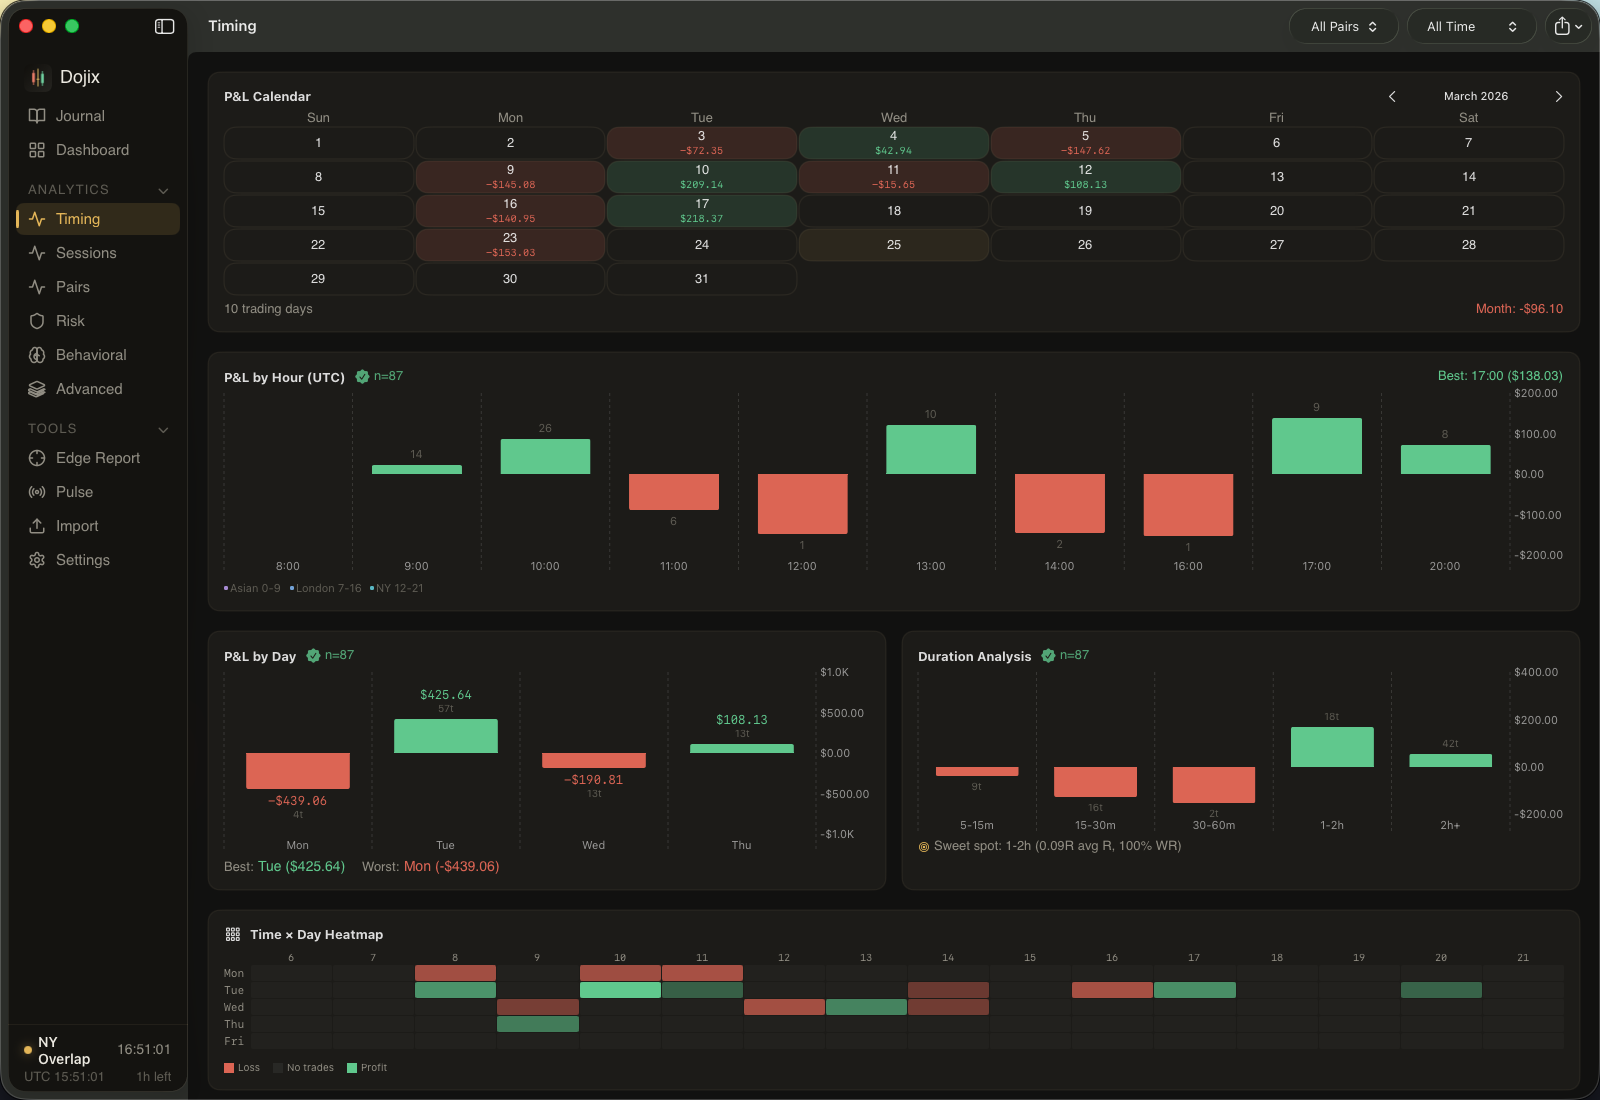
Timing Analytics
When do you trade best? Calendar view, hourly P&L breakdown, day-of-week analysis, and trade duration insights tell you exactly when your edge is sharpest.
- Trade calendar with daily P&L heatmap
- Hourly P&L chart: see which hours pay you
- Day-of-week breakdown with win rate and profit factor
- Duration analysis: are you holding too long or cutting too short?
- Trade time heatmap: hour vs. day grid
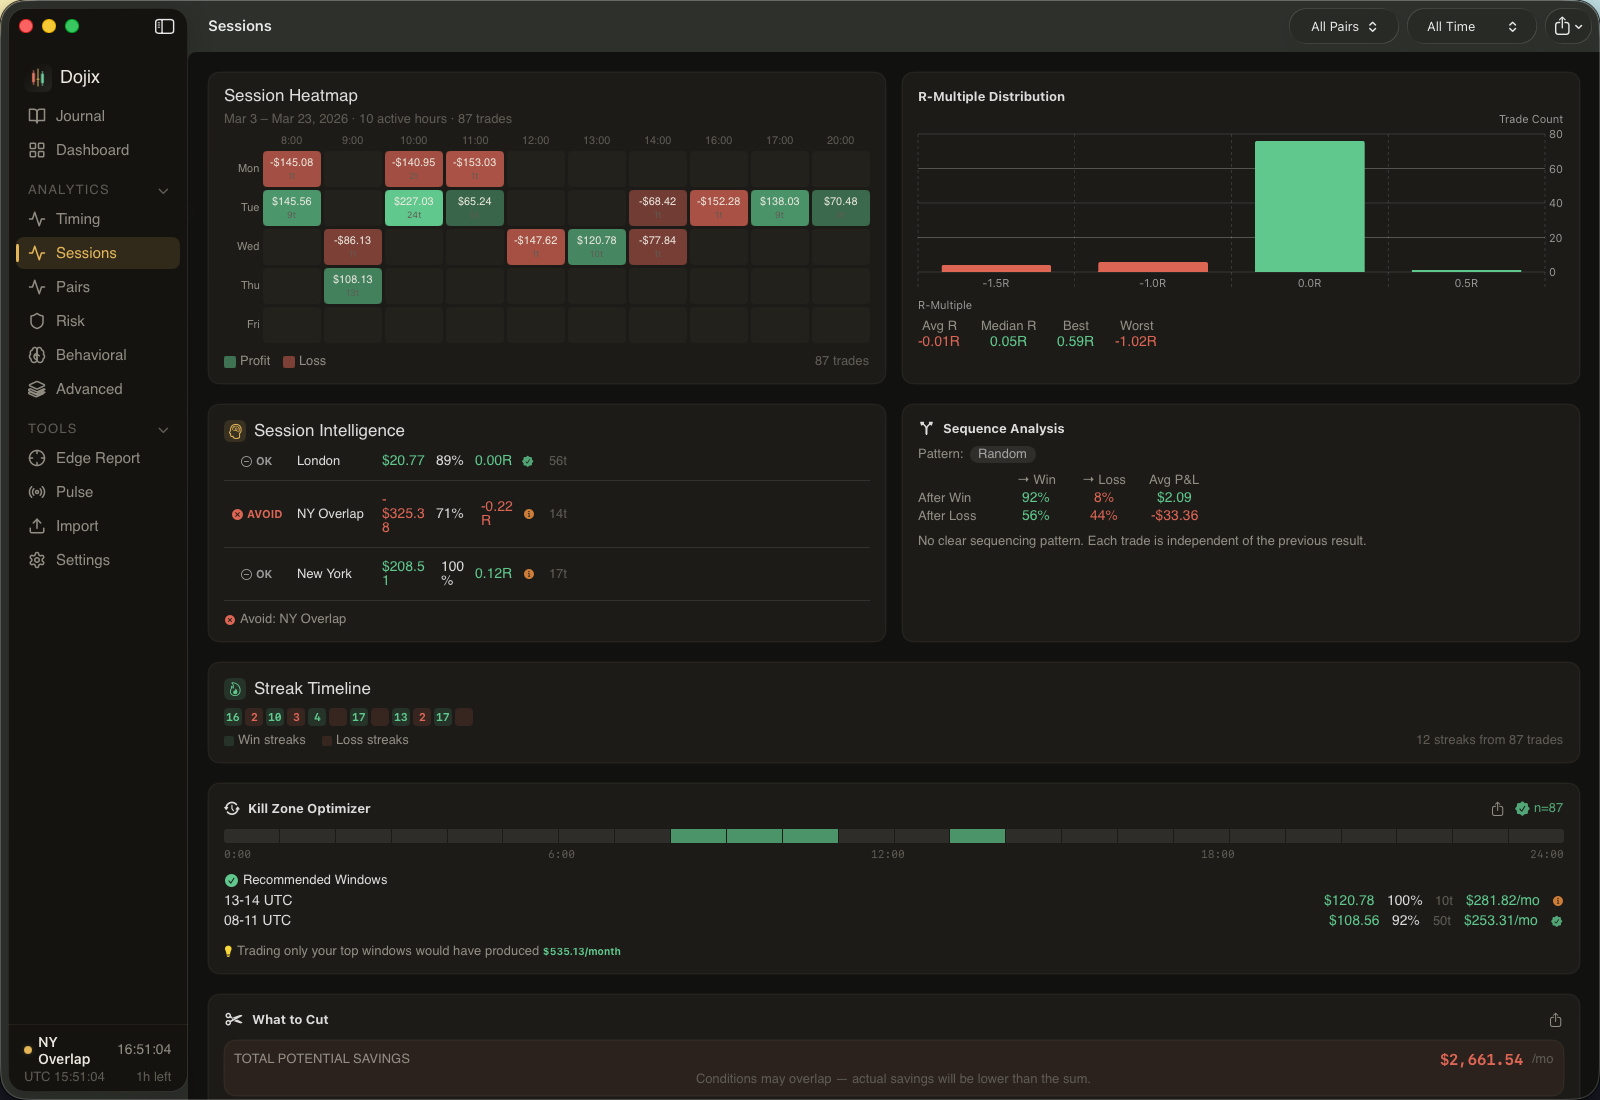
Sessions & Kill Zones
Session-level edge analysis that no other journal offers. See P&L by session and hour, find your optimal kill zones, and understand your win/loss streaks.
- Session heatmap: P&L by hour and day of week
- Kill Zone Optimizer: your most profitable time windows
- Session intelligence with per-session edge signals
- Sequence analysis: win/loss streak patterns
- Streak timeline: visualize momentum shifts
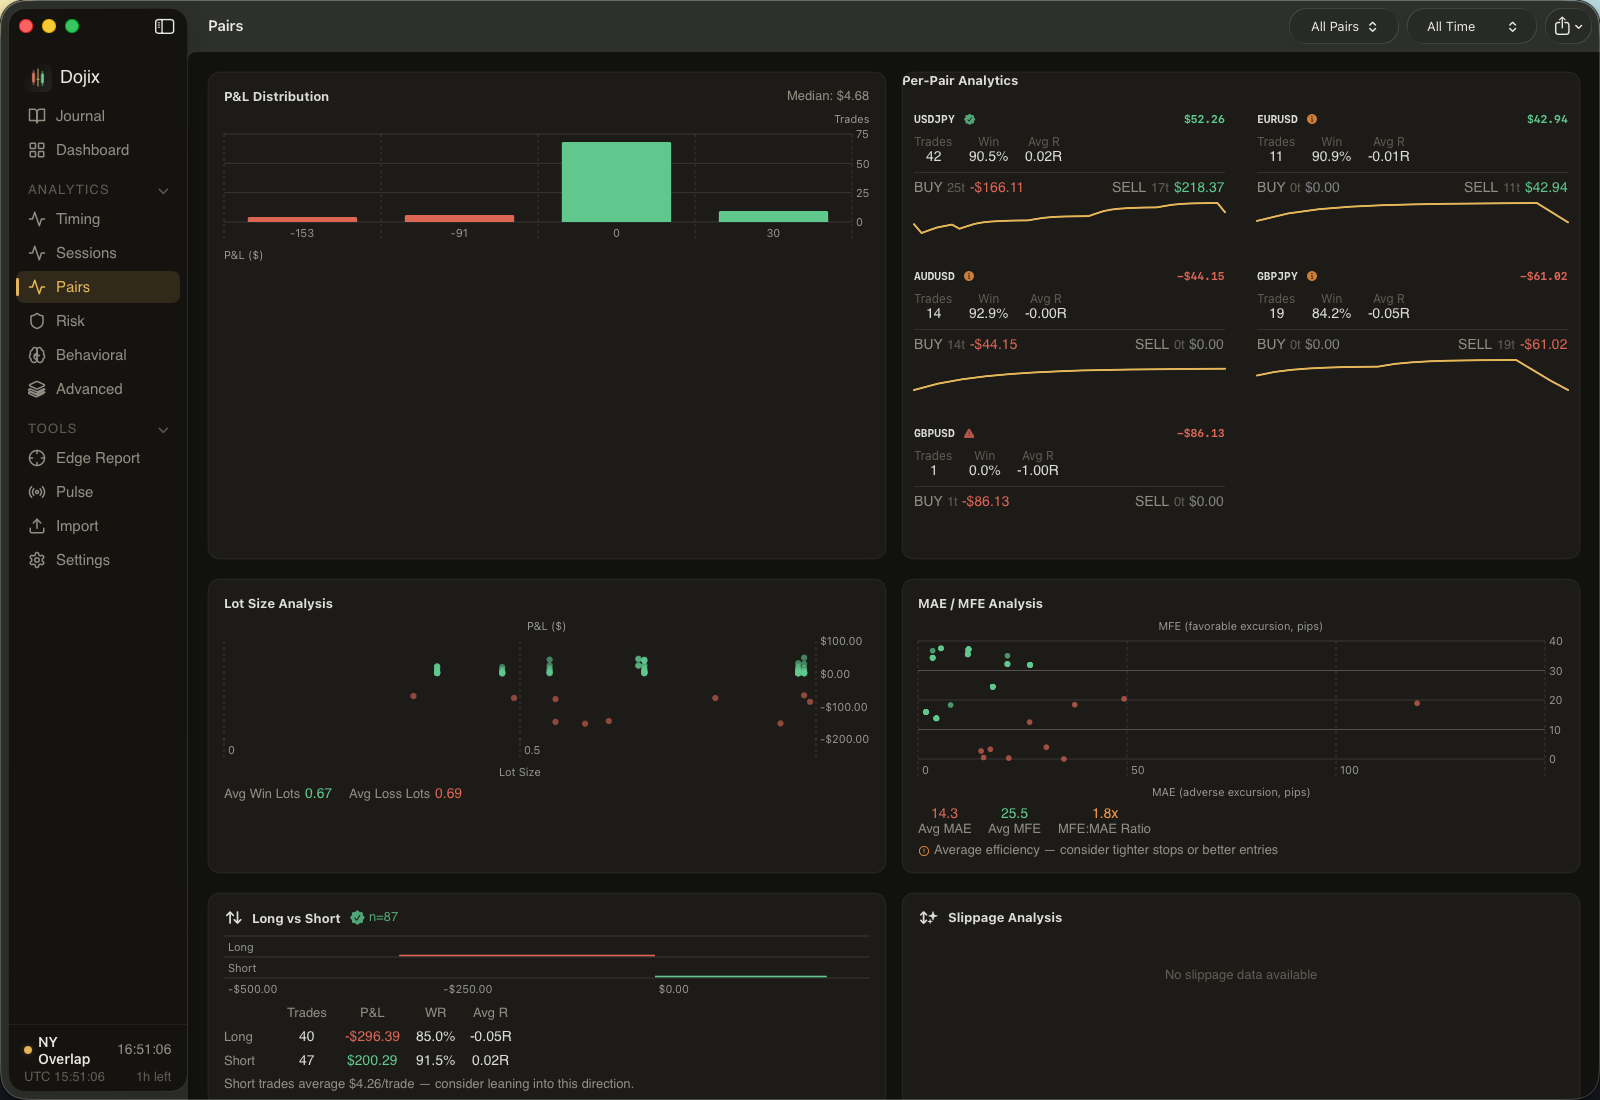
Pair & Instrument Analytics
Deep analysis of what you trade and how. Win/loss distributions, per-pair metrics, directional bias, lot sizing patterns, and correlation analysis.
- Win/loss distribution with R-multiple histogram
- Per-pair analytics: win rate, PF, average P&L, trade count
- Directional edge: long vs. short performance per pair
- Lot size analysis: are you sizing up after losses?
- Pair correlation matrix with diversification insights
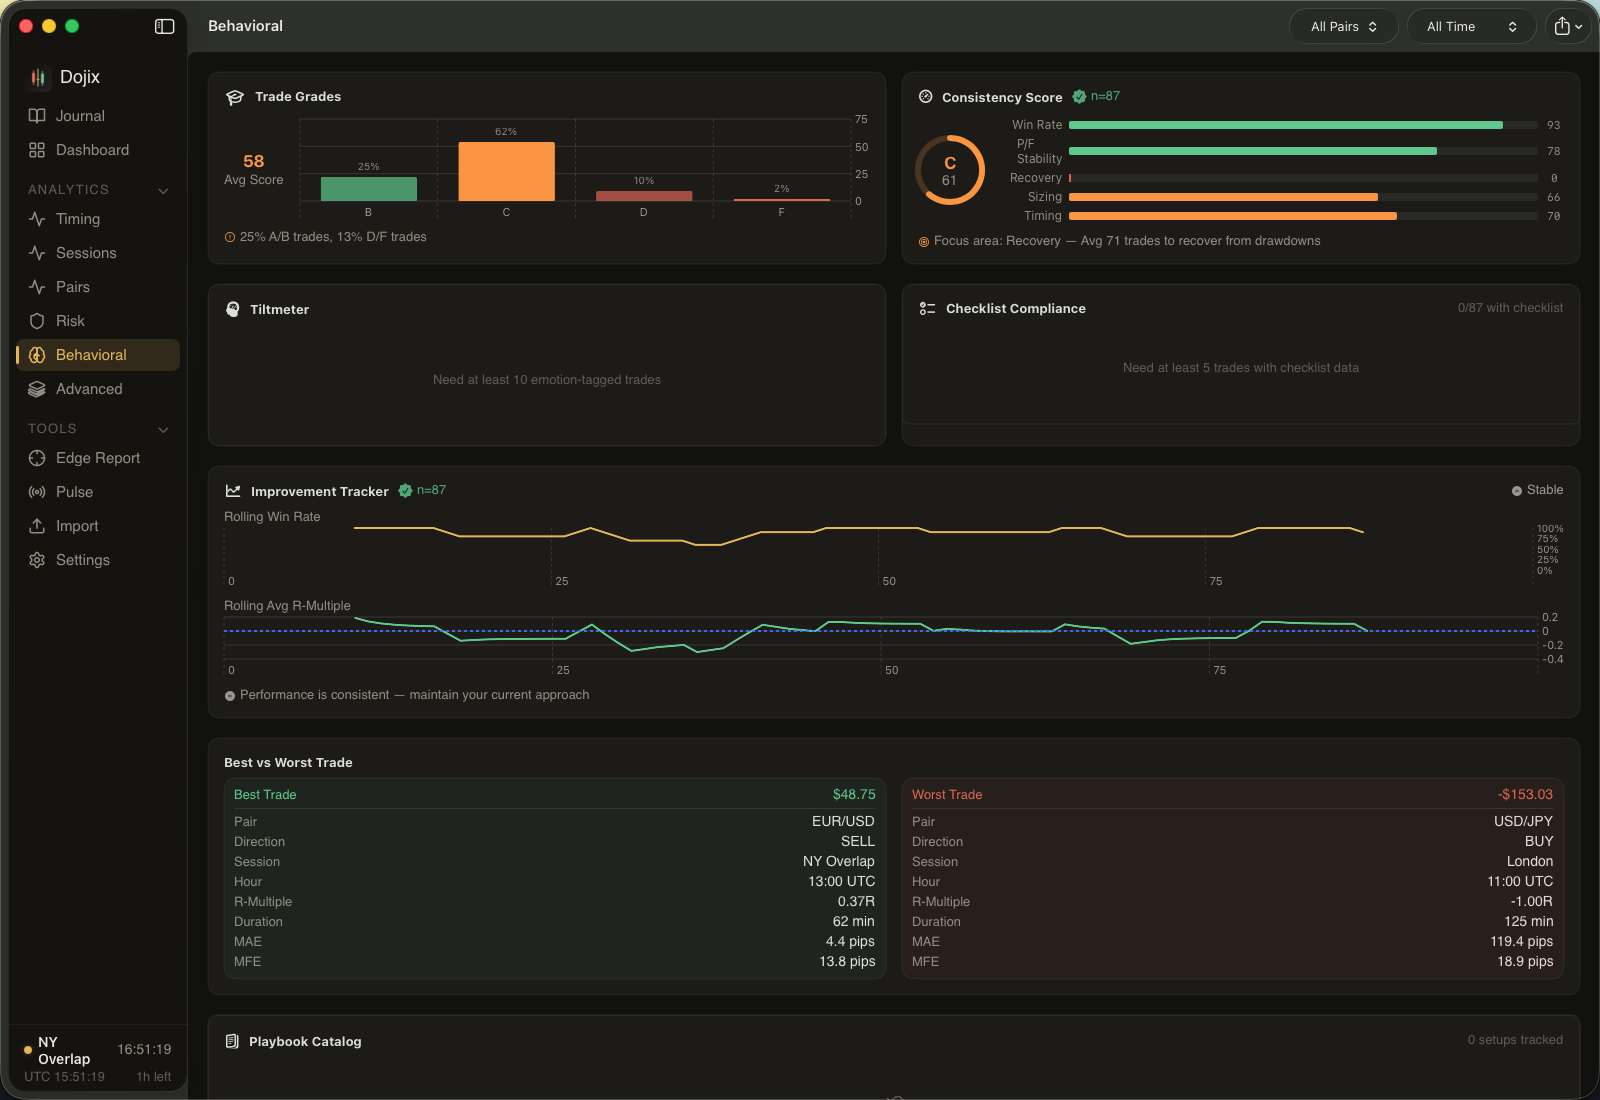
Behavioral Analytics
The features that separate serious traders from everyone else. Know your discipline score, consistency score, and whether you're improving or slipping.
- Discipline Score (A-F): overtrading, revenge, tilt, sizing
- Consistency Score: win rate stability, recovery speed
- Trade Grades: A-F distribution across your history
- Emotional P&L: Calm, Confident, Anxious, FOMO, Revenge
- Checklist compliance: dollar impact of following your rules
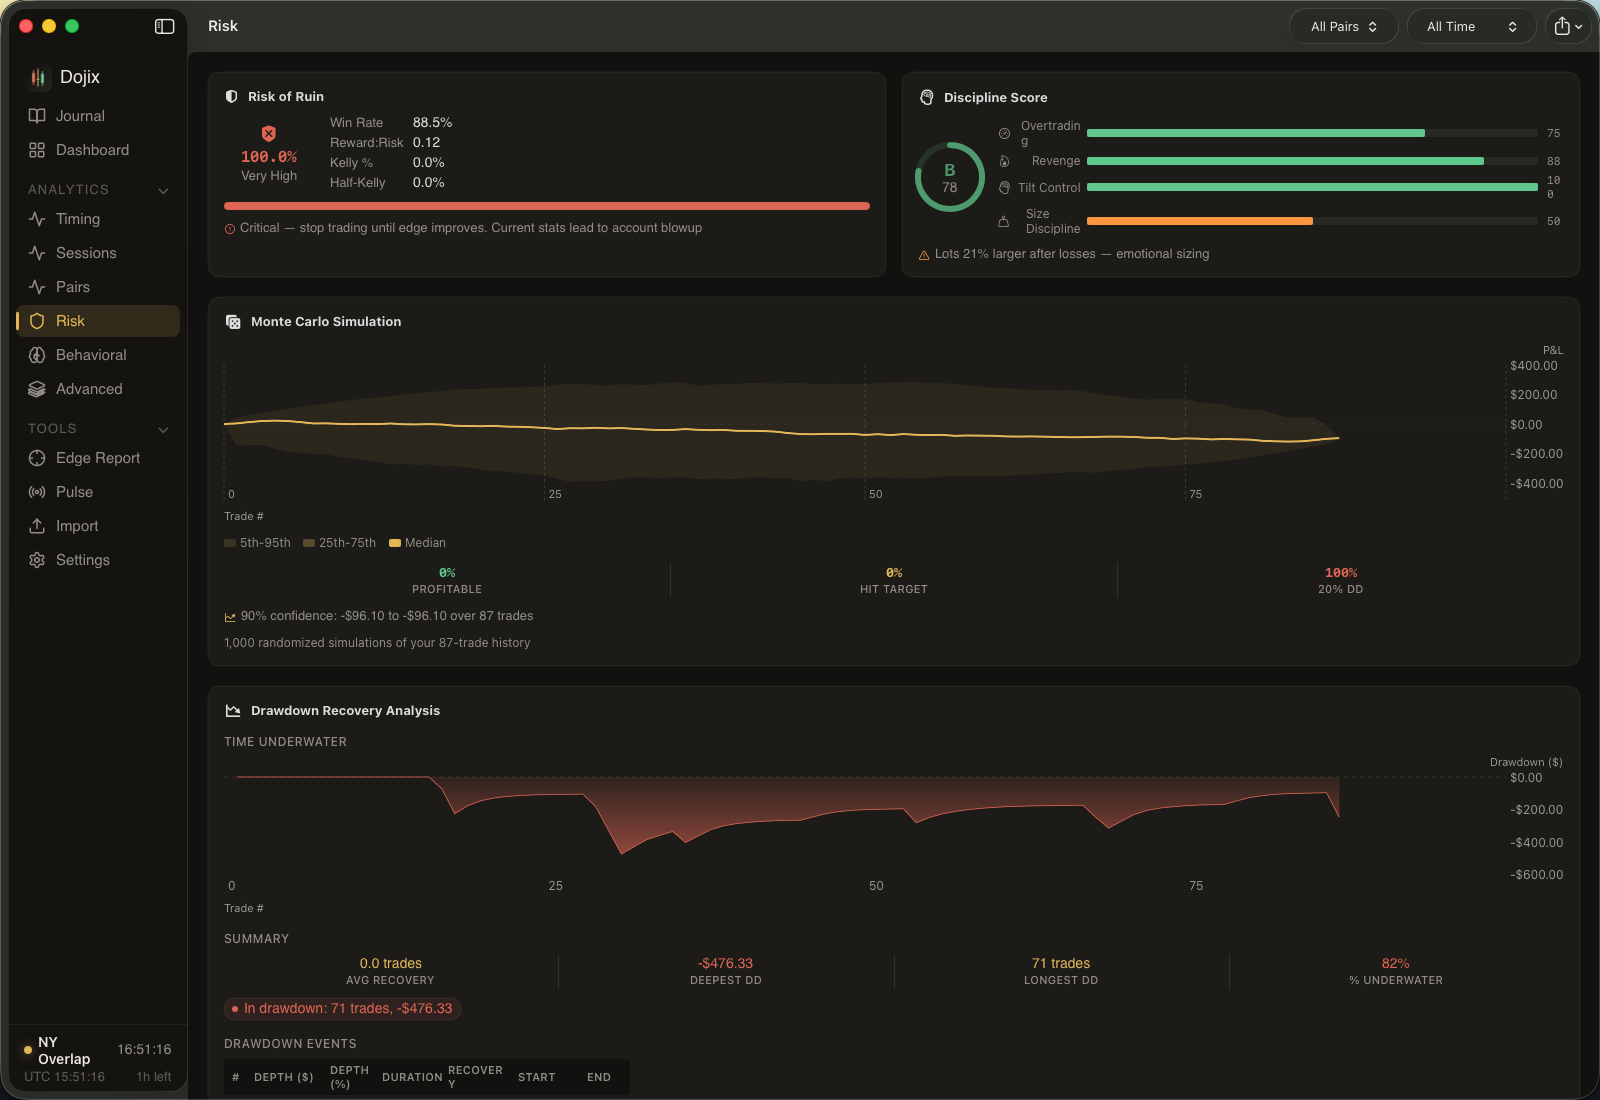
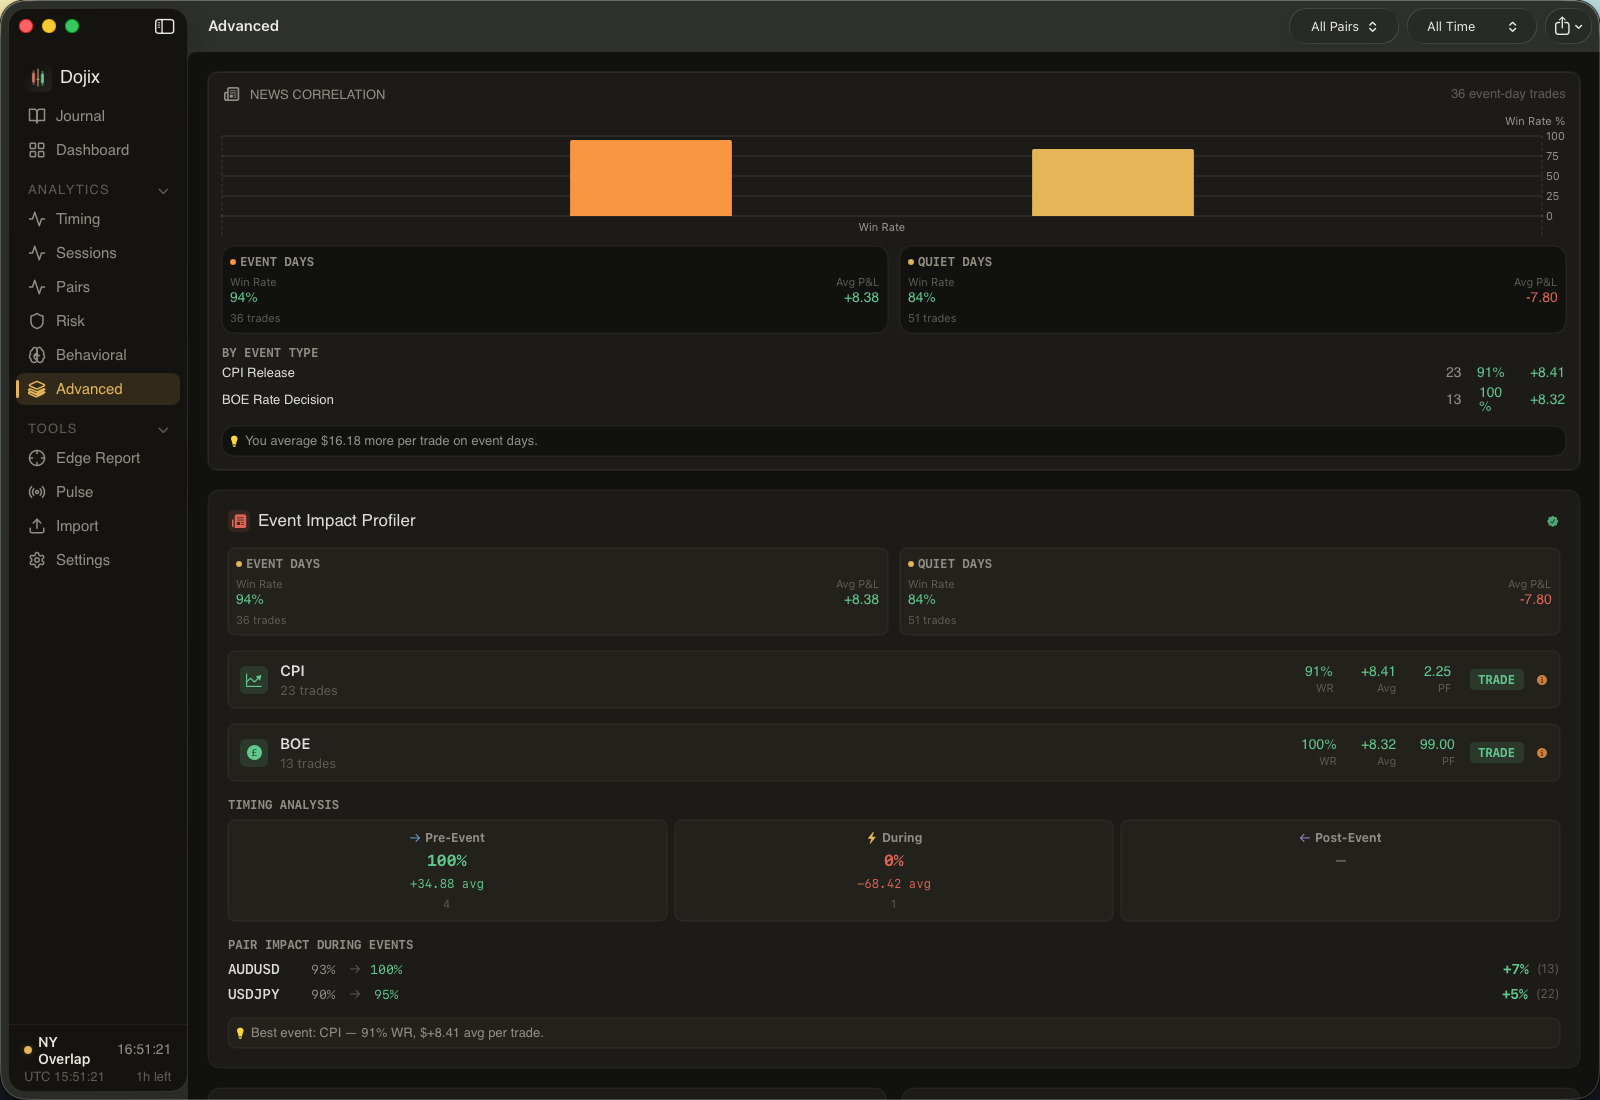
Risk & Growth Projections
Understand your drawdown patterns, project your account growth, and size your positions based on actual data rather than guesswork.
- Drawdown recovery: time underwater, depth, behavior during DD
- Growth projections with compounding scenarios
- Position sizer based on your actual risk metrics
- Sharpe, Calmar, and Sortino ratios
- Event Impact Profiler: how NFP, FOMC, CPI affect your P&L
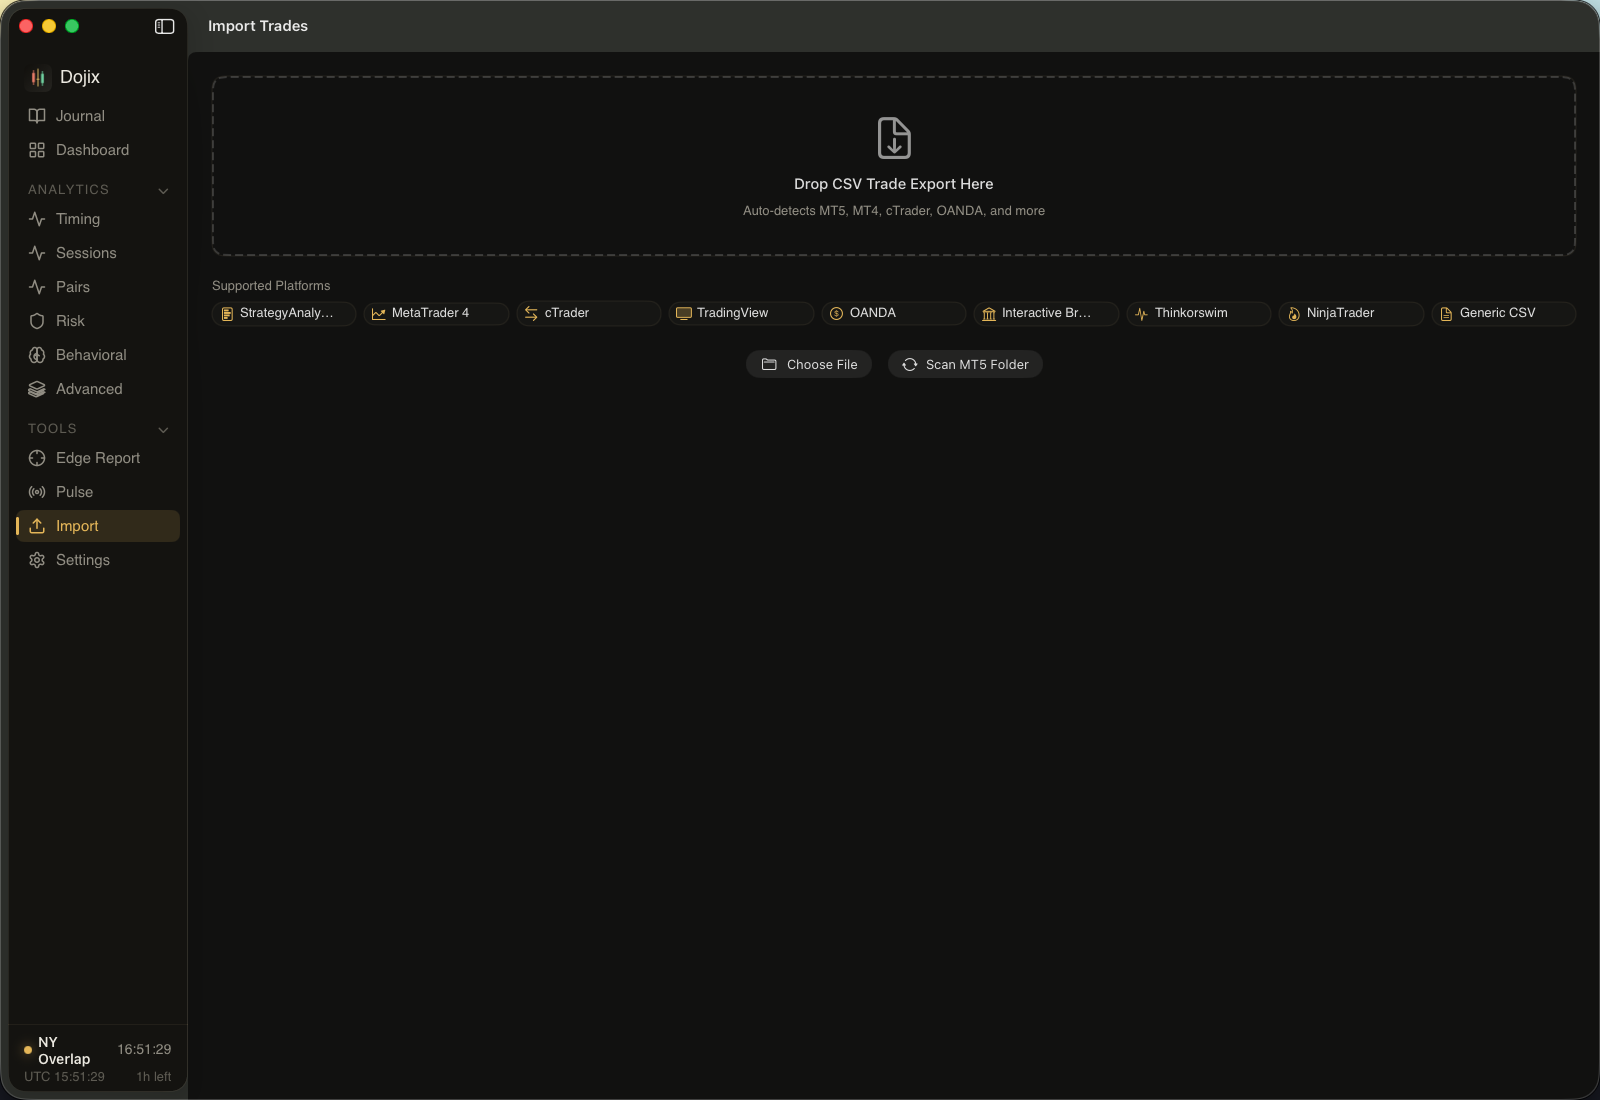
Import from Anywhere
Drag-and-drop any CSV and Dojix auto-detects the format. Or connect directly to OANDA via API. Supports 9 platforms out of the box.
- MT5 StrategyAnalytics with 38 computed fields per trade
- MT4, cTrader, TradingView, NinjaTrader
- OANDA direct API import (no CSV needed)
- Interactive Brokers, Thinkorswim
- Generic CSV with column mapping UI
66 analytics. Zero fluff.
Every component earns its place by answering a question about your trading.
Import from anywhere
Drag-and-drop any CSV. Dojix auto-detects the format.
Don't see your platform? The generic CSV importer with column mapping handles any format.